Measures of Variation Quiz
Share


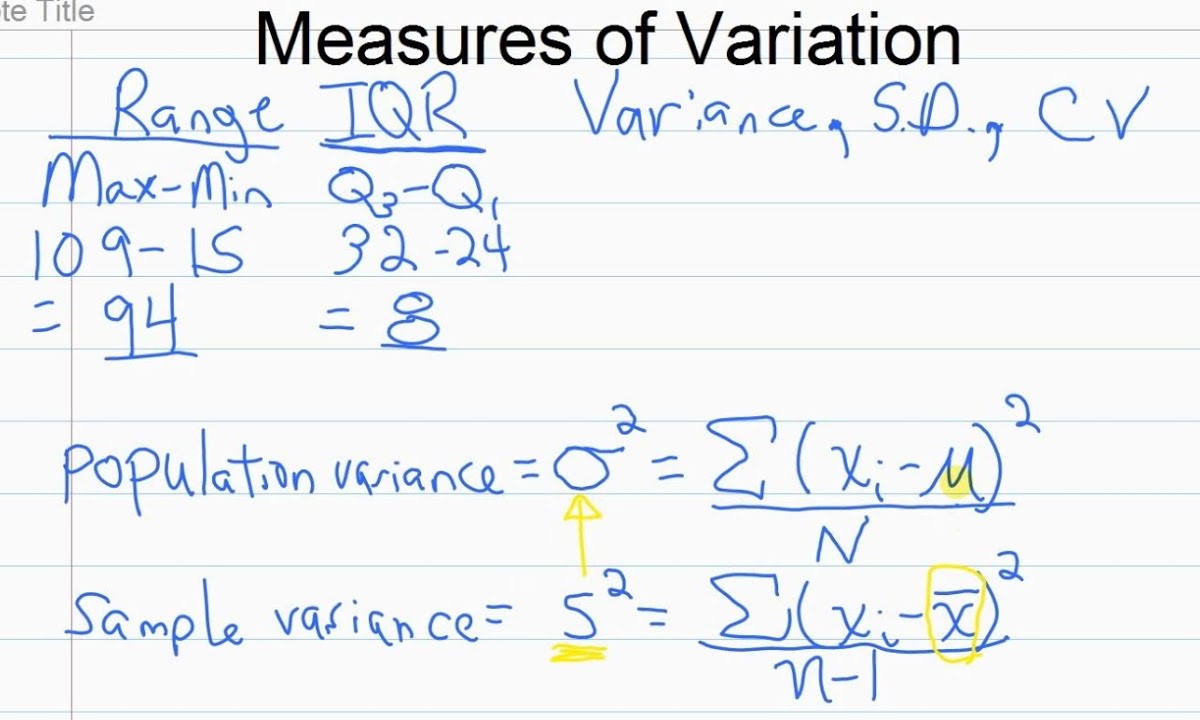
Understanding the spread and dispersion of data is crucial in statistics. Measures of variation provide insights into how data points differ from each other and the mean. This quiz will challenge your knowledge on various statistical measures that quantify this variability. Test your skills and see how well you grasp these fundamental concepts!
We recommend that you do not leave the page that you are taking this quiz in. Stay honest 🙂
Measures of Variation Quiz Questions Overview
1. What does the range of a data set represent?
The average value of the data set
The difference between the highest and lowest values
The sum of all values
The middle value of the data set
2. Which measure of variation is most affected by extreme values?
Range
Interquartile Range
Variance
Standard Deviation
3. What does the standard deviation measure?
The average distance of each data point from the mean
The difference between the highest and lowest values
The middle value of the data set
The sum of all values divided by the number of values
4. How is variance related to standard deviation?
Variance is the square root of standard deviation
Variance is the square of standard deviation
Variance is double the standard deviation
Variance is half the standard deviation
5. What is the interquartile range (IQR)?
The difference between the highest and lowest values
The range of the middle 50% of the data
The average value of the data set
The sum of all values divided by the number of values
6. Which measure of variation is least affected by outliers?
Range
Standard Deviation
Variance
Interquartile Range
7. In a normal distribution, approximately what percentage of data falls within one standard deviation of the mean?
50%
68%
95%
99.7%
8. What is the purpose of using measures of variation in statistics?
To find the central tendency
To understand the spread of data
To calculate the total sum of data
To determine the mode of the data
9. Which measure of variation is used to compare the spread of two different data sets with different units?
Range
Variance
Standard Deviation
Coefficient of Variation
10. If the standard deviation of a data set is zero, what can be said about the data?
All data points are the same
The data set has a large range
The data set is skewed
The mean of the data set is zero
11. What does a high standard deviation indicate about a data set?
Data points are close to the mean
Data points are widely spread out
The data set has no outliers
The data set has a small range
12. How do you calculate the range of a data set?
Subtract the smallest value from the largest value
Add all values together
Find the middle value of the data set
Divide the sum of all values by the number of values
13. Which measure of variation is used to describe the average squared deviations from the mean?
Range
Interquartile Range
Variance
Standard Deviation
14. What is the relationship between the interquartile range (IQR) and outliers?
IQR is used to calculate the mean
IQR helps to identify outliers
IQR is unaffected by outliers
IQR is the same as the range
15. Which measure of variation is calculated by taking the square root of the variance?
Range
Interquartile Range
Standard Deviation
Mean
16. Why is the interquartile range (IQR) considered a robust measure of variation?
It uses all data points
It is not affected by extreme values
It is always larger than the range
It is calculated using the mean
17. What is the purpose of using the coefficient of variation?
To compare variability between data sets with different units
To find the range of a data set
To calculate the mean
To determine the mode of the data
We recommend that you do not leave the page that you are taking this quiz in. Stay honest 🙂
Can Your Friends Do Better Than You in This Quiz?
Share this quiz with your friends and compare results.


Was this page helpful?
More Popular Math Quizzes:
-
 Top Quiz
3D Shapes Quiz
-
 Top Quiz
Dividing Fractions Quiz
-
 Top Quiz
Grade 7 Integers Quiz
-
 Top Quiz
Inequalities Quiz
-
 Top Quiz
Set Theory Quiz
-
 Top Quiz
Conic Sections Quiz
More Interesting Quizzes For You:
-
 Top Quiz
Kids Exercise Quiz
-
 Top Quiz
Ultrasound Tech Quiz
-
 Top Quiz
Weed Addiction Quiz
-
 Top Quiz
Benefits of HIT Quiz
-
 Top Quiz
Excel File Quiz
-
 Top Quiz
Hamilton Quiz